

Have you ever wondered how traders make money by buying and selling stocks within the same day? Day trading is a fast-paced investment strategy that can yield significant returns if executed correctly. It involves making multiple trades within a single day, capitalizing on small price movements. This guide will delve into effective day trading strategies, providing you with the tools you need for success.
Understanding Day Trading Strategies
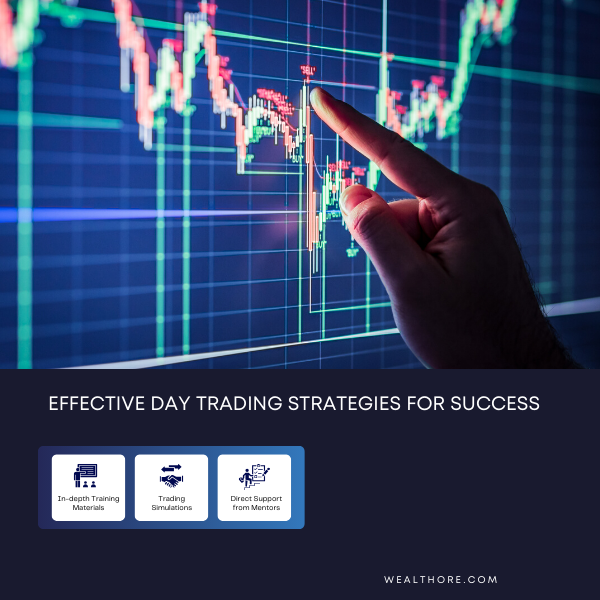
Day trading strategies are crucial for navigating the volatile market landscape. The right approach helps identify profitable opportunities and manage risks effectively. This post will explore two primary strategies: trend following and contrarian trading.
Trend Following Strategy
The trend following strategy is based on the principle that prices move in identifiable patterns over time. This strategy involves tracking the direction of market trends and making trades that align with these movements.
Identifying Trends
To implement a trend-following strategy, you must first identify trends. Trends can be upward (bullish), downward (bearish), or sideways (range-bound). Analyzing price charts over a specified period helps spot these trends. For instance, if you see a series of higher highs and higher lows, you are likely observing an upward trend. Conversely, a series of lower highs and lower lows indicates a downward trend. Sideways trends, where the price oscillates within a range, require different trading tactics, often involving buying at support and selling at resistance levels.
Identifying Trends in Detail
Trends are a fundamental aspect of day trading. They represent the general direction in which the market or a particular asset is moving. To identify trends accurately, traders use various tools and techniques:
Candlestick Patterns: These are specific formations on a candlestick chart that suggest potential market movements. Common patterns include the Doji, Hammer, and Engulfing patterns. Each of these patterns can indicate a potential reversal or continuation of the current trend.
Volume Analysis: This involves looking at the number of shares or contracts traded in a security or market during a given period. High volume often confirms the strength of a trend, while low volume might indicate a potential reversal or a lack of interest in the current price movement.
Support and Resistance Levels: These are specific price points on a chart where an asset tends to find support as it falls or resistance as it rises. Identifying these levels can help traders make informed decisions about entry and exit points.
Using Moving Averages
Moving averages are vital tools for identifying trends. They smooth out price data, making it easier to determine the direction of the trend. Common moving averages include the simple moving average (SMA) and the exponential moving average (EMA). An upward trend is indicated when the price is above the moving average, and a downward trend is indicated when the price is below it. Moving averages also help in identifying trend reversals. For example, a crossover where the short-term moving average crosses above the long-term moving average might signal a buying opportunity. Conversely, a crossover where the short-term moving average crosses below the long-term moving average might signal a selling opportunity.
For more detailed information on using moving averages in your trading strategy, you can check out Investopedia’s Guide on Moving Averages
Contrarian Trading Strategy
Contrarian trading, or counter-trend trading, involves taking positions against the prevailing market trends. This strategy aims to capitalize on market corrections and reversals. It requires a keen understanding of market psychology and the ability to spot overreactions to news and events.
Spotting Reversals
Spotting potential reversals is crucial for contrarian trading. Technical indicators such as the Relative Strength Index (RSI) or the Moving Average Convergence Divergence (MACD) help identify overbought or oversold conditions. An overbought signal may indicate it’s time to sell, while an oversold signal may suggest it’s time to buy. The RSI, for example, measures the speed and change of price movements. An RSI above 70 typically indicates that a stock is overbought, while an RSI below 30 suggests that it is oversold. MACD, on the other hand, shows the relationship between two moving averages of a security’s price, and the crossing of these averages can signal potential buy or sell opportunities.
Implementing Counter-Trend Trades
After identifying a potential reversal, you can implement counter-trend trades. This involves taking a position opposite to the current trend, expecting the price to reverse. Using stop-loss orders is essential to protect your investment if the market continues to move against your position. It’s also beneficial to look for confirmation of the reversal through price action, such as candlestick patterns (e.g., hammer, engulfing pattern) or volume analysis. This additional layer of analysis can increase the probability of a successful trade.
For further insights into contrarian trading, stay glued to wealthore for a detailed and helpful guide.
Risk Management in Day Trading
Effective risk management is paramount in day trading. The market’s volatility necessitates a solid risk management plan to protect your capital. Without proper risk management, even the most effective trading strategies can lead to significant losses.
Setting Stop-Loss Orders
Stop-loss orders are crucial tools for risk management. A stop-loss order automatically sells a security when it reaches a predetermined price, limiting potential losses. This ensures that you do not lose more than you are willing to risk on a single trade. For example, if you buy a stock at $100 and set a stop-loss order at $95, the stock will be sold automatically if its price drops to $95, thus limiting your loss to $5 per share. This is especially important in day trading where prices can fluctuate rapidly.
Position Sizing
Position sizing is another key aspect of risk management. It involves determining the appropriate amount of capital to allocate to each trade. By using a fixed percentage of your total capital for each trade, you can manage your risk exposure and avoid significant losses. A common rule is to risk only 1-2% of your trading capital on a single trade. For instance, if you have a trading capital of $10,000, you might decide to risk only $100-$200 per trade. This helps in preserving your capital over the long term, even if you encounter a series of losing trades.
Beyond stop-loss orders and position sizing, other risk management techniques include:
Diversification: Spreading your trades across different assets or sectors can reduce risk. For example, if you only trade tech stocks, you’re highly exposed to sector-specific risks. Diversifying into other sectors or asset classes can help mitigate this.
Regular Review and Adjustment: Continuously reviewing and adjusting your trading strategy based on performance and market conditions is crucial. Keeping a trading journal to track your trades and reflect on what worked and what didn’t can be invaluable for long-term success.
Conclusion
Day trading can be a rewarding endeavor if approached with the right strategies and risk management techniques. By understanding and implementing trend-following and contrarian trading strategies, identifying trends and reversals, and managing risks through stop-loss orders and proper position sizing, you can enhance your chances of success in the fast-paced world of day trading.
Whether you are a seasoned trader or a beginner, these strategies can help you navigate the markets and achieve your trading goals. What has been your experience with day trading strategies, and what tips would you share with new traders? Let us know in the comments below!
For more insights on day trading and other investment strategies, visit WealthOre.com. Happy trading!
Additionally, you might want to explore more about trading strategies and market analysis on Investopedia to further enhance your trading knowledge.